At the end of March 2021, another release of the multi-functional digital monitoring and control platform SAYMON was published. A little more than a month has passed since the previous release, and the company’s specialists have prepared and released a new version with the improvement of some functional components and the expansion of the user interface capabilities.
Improvement of the mechanism for setting the geo-position of objects.
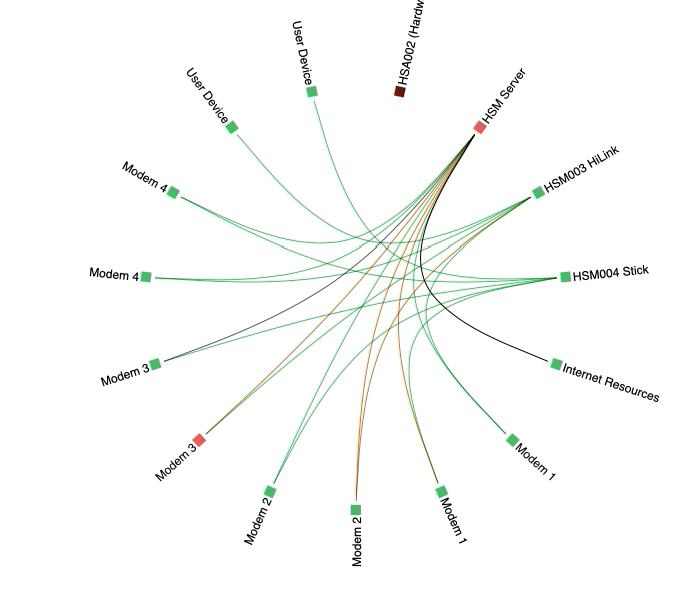
Monitoring objects in the interface of the software package can be linked to their geographic locations for later viewing on a map. Activation by the user of the mode of displaying information in the form of a geo-map (“geoview”) results in displaying a map of objects with specified coordinates and links between them. Such functionality is widely applied in practice, easy to use and clear, especially in cases when the maintained infrastructure is geographically distributed.
An example lying “on the surface” is the network equipment of a telecom operator or provider of access to public Internet networks, which can be “tied” to the addresses of buildings and constructions of the location of communication nodes with the formation of a network map as a result. Other quite obvious examples are monitoring and control of the distributed ICT infrastructure of enterprises in the oil and gas, energy industries, transport logistics, environmental monitoring, and other types of natural and economic systems subject to monitoring and control.
In the course of work on the current release of the platform, the algorithm for setting the geographical position of objects on the map was improved: when the user first switches to the “geoview” mode, a place with the average latitude and longitude for the set of visualized objects will be shown in the center of the screen.
Thus, the user now does not need to waste time on initial movements around the map to the location of the objects of interest: the focus will be switched by default to the map fragment with their largest concentration. The map offsets and the display scale selected during operation are saved in the user’s web browser for subsequent sessions.
Implementation of the ability to temporarily set the range for displaying data on charts and widgets
The SAYMON platform interface allows to create summary dashboards, including widgets of different types, displaying aggregated metric values changing over time for certain objects. In a practical sense, such displays are very useful and in demand both by specialists of monitoring services and technical support of users, as well as by highly qualified engineering personnel, as well as by administrative divisions of companies.
By default, charts and widgets provide data for the past hour. For widgets displaying data for a time period, the latter value can be set individually when the widget is created.
The button “Widgets time range” added to the right side of the “Breadcrumbs” panel of the interface allows to temporarily set a different range for displaying data on all charts and widgets simultaneously. Pressing this button initiates the opening of a drop-down window, in which anyone can select the time range of interest (absolute or relative), the method of counting the range (present moment or calendar period) and units of measurement (group by time).
Based on the results of a user selection of a new range and its parameters, graphics and widgets will be rebuilt with a change in scale. The specified period of time will be displayed directly on the button (in expanded form). When switching to the neighboring objects in the hierarchy, the assigned range is not reset, and the corresponding charts and widgets are also rebuilt.
As an illustrative practical example, the image and the video show the operation of SAYMON with data received from a weather web service: the dashboard contains graphs of temperature and relative humidity changes over time in five cities of the world. It has been demonstrated that the new features of the web interface allow conveniently varying the time ranges for displaying data and, if necessary, exporting them for the range of interest to table processors.
Dashboards of the platform can visualize time-varying data from a wide variety of areas: ICT (CPU load, memory utilization, productivity of disk subsystems, network activity, indicators of work of individual applications and services), economy and management (performance indicators of a department or company as a whole), medicine and public health, ecology and environmental management etc.
Dashboards can be formed both using the web interface and software tools. Often, only the primary modeling of the desired picture occurs in the user interface, and with the help of specially implemented small programs, the views necessary for administrators, analysts and managers are automatically generated. Thus, the platform implements the “monitoring as code” approach which is consistent with the current trend of growing popularity of software-defined infrastructures.
Migrating to a new version of MongoDB
In the process of preparing the release, a migration was made to a new version (4.2) of the MongoDB database management system (from version 3.4). The document-oriented horizontally scalable MongoDB DBMS is known to be one of the classic examples of NoSQL systems that do not have a predefined structure describing the table schema, using JSON-like documents and the database schema. MongoDB is currently being intensively used in practice when solving problems of storing and registering events, monitoring data, ensuring the effective operation of document and content management systems, in mobile applications, etc.
In version 4.2, a number of new features and improvements were added to the DBMS aimed at increasing the performance, reliability and compatibility, including distributed transactions, sharded clusters, drivers compatible with the latest versions of popular programming languages, security and data aggregation improvements, optimized index building and some others.
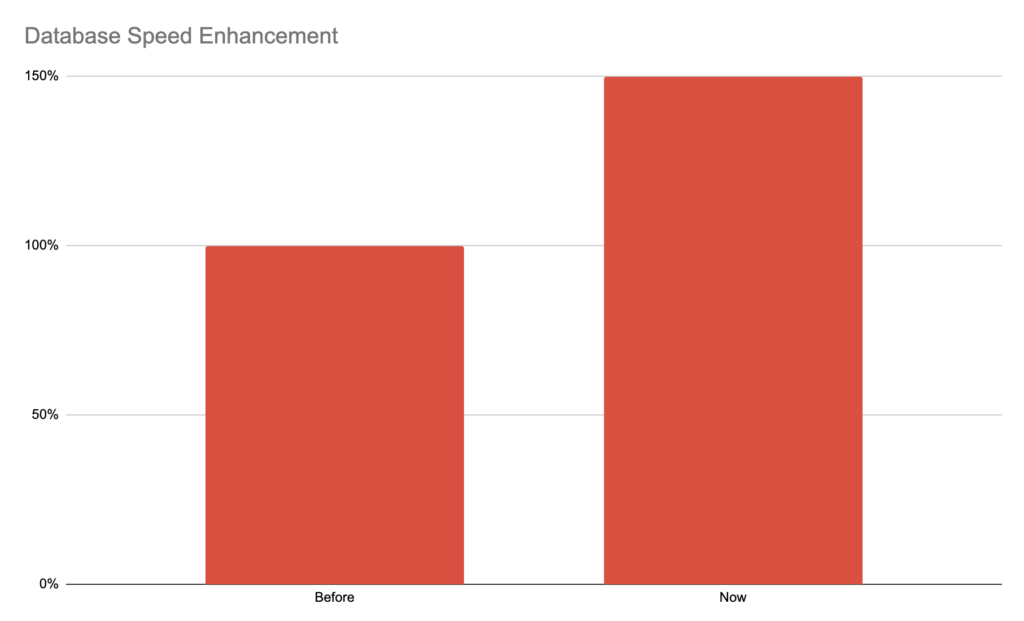
In the SAYMON software package MongoDB is used to store information on objects and connections, their properties and historical data on states. The focus on this DBMS allows you to maintain the overall high performance of the solution and the speed of query execution. The tests carried out after the update showed an increase in the read/write performance by 1.3/1.5 times, respectively. Internal optimizations in some cases (for example, when creating a large number of new objects) reduce the execution time of operations by an order of magnitude in comparison with version 3.4.
SAYMON is a high-performance digital platform for integrated monitoring and management of global ICT infrastructures, your indispensable intellectual assistant in solving problems of digital transformation and integrated automation of enterprises in various industries, managing converged ICT environments and consolidating digital information flows.
Stay tuned with SAYMON updates.
Subscribe to our social media channels.
Email to contact@saymon.tech
Call +1 323 6474576