The SAYMON platform enables system integrators and digital companies to create solutions for specific business requirements.
At the south end, it can be IP network, VoIP infrastructure, SAN, metals or virtualized resources and services. In the north – Web 2.0 or Mobile Apps of certain logic.
SAYMON supports many options for object hierarchies. You can have hundreds of thousands of objects in your infrastructure. Objects can be linked by links. Links can be of the nature of media or represent logical information exchange. Links and objects can have an associated health-check method. Authorized users can define good/bad condition criteria as well as provide additional information such as address or person in charge. Both human-centered web interface and automation APIs are available to manage all of this.
Netmap is one of the web applications for the northern part of SAYMON.
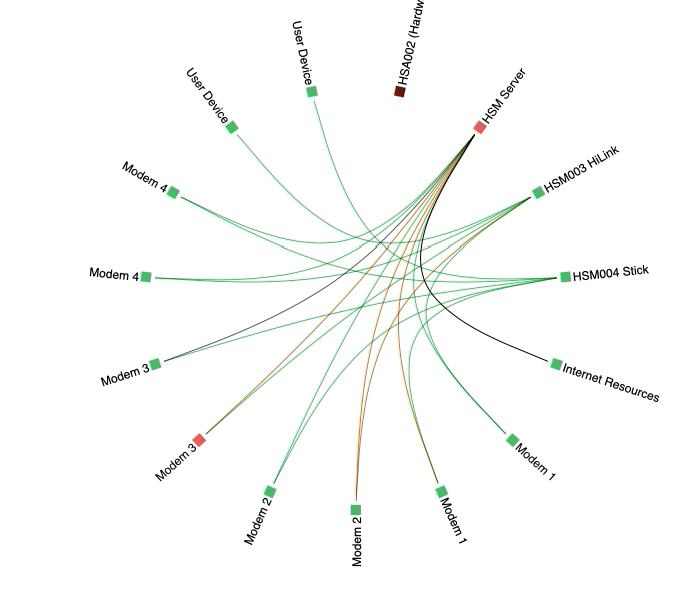
Netmap 4.0 supports visualization of hierarchical boundaries and network graphics. Hierarchical Edge is a new version 4 killer feature. Netmap is useful for duty teams, network and service operations centers, as well as system architects and team leaders.
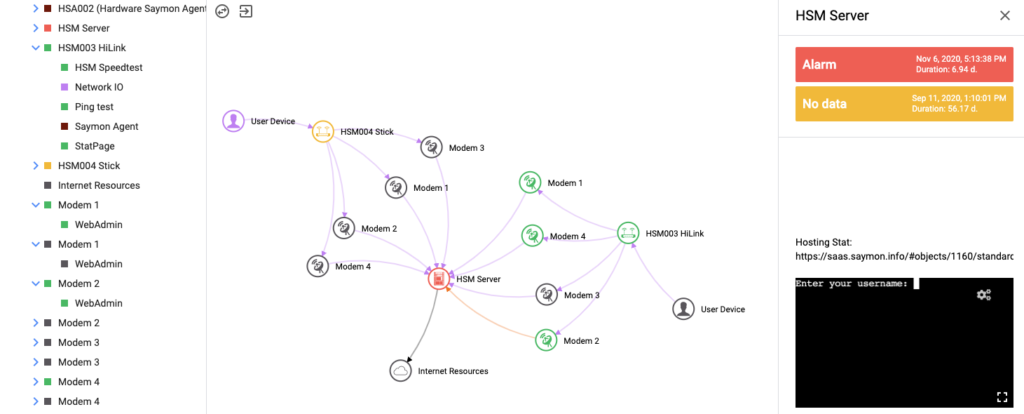
SAYMON Netmap is a software extension for SAYMON platform. That allows customers to visualise infrastructure map as a graph. In a wide meaning this works for any kind of infrastructure. In our days it is right to say for digital infrastructures.
To be more specific, we would be loved to see applince in:
network visualisation, including dynamic routing protocols and sla-control
voip service infrastructure visualisation
storage area network visualisation
virtualisation infrastructure visualisation
data-centers and data-channels infrastructures
energy network visualisation
This list is not finished for sure. The Netmap of SAYMON is also great for people, companies, countries and economics relations visualisation.
Based on SAYMON, SAYMON Netmap and you own data-sources you can build up almost any kind of system viualisation. Even if you want to viualisate and understand humanbody parts relationship and inter-affect.
Current version: 4.0
Add Hierarchical Edge visualisation
Version 3.0
Keep tree open through page reload functionality
Selected object highlight in the objects tree
Real-time information update – COMET connectivity transport
Tree and graph real-time status update with COMET information arrival
Add more properties visualisation in an object/link card
Periodic session refresh, 60 sec by default
Version 2.0
Auth is added to SPA engine, so login screen and exit button in user interface
Link card is added, so you can click both graph node object and link on graph now
Multi-link visualisation on graph is added
Links are listed in the tree to represent state escalation clearly
Single objects click in tree is disabled to avoid false visualisation
Graph visualisation enhanced to use whole space of the screen available
Graph nodes drag-n-drop removed
Initial version is 1.0
Objects tree
Network graph visualisation
Object details card – last three states, ip address property and remote access initiation
Graph node click support to show the card
Video
Contact for approbation
Please mail to welcome@saymon.tech if you would like to try this on your infrastructure.